Federal Recovery Funds Dashboard


Last Updated: 2024-04-22


Federal COVID-19 pandemic-response packages have provided unprecedented aid to state and local governments, including $800 billion that can be used flexibly to promote an inclusive recovery. These resources create an unparalleled opportunity for advocates and local decision-makers to ensure federal funds reach communities that need them most, close equity gaps exacerbated by the pandemic, and address the root causes of inequities. To take advantage of this opportunity, local leaders need timely data and evidence to ensure funds are used effectively and equitably.

This dashboard tracks a subset of the federal recovery funds flowing into the City of Chicago, Cook County, and the State of Illinois that can be used for inclusive recovery efforts that align with key priorities of The Chicago Community Trust: community investment, community safety, household investment, housing, and workforce development, which are all vital to narrowing the Chicago region’s racial and ethnic wealth gap. The dashboard primarily tracks appropriations, or how much funding the federal government has committed to provide local jurisdictions. For a few select programs where information is available, the dashboard also explores spending by zip code.

We will add more program allocation and spending information as new data become available. For more information, including the glossary and frequently asked questions, see About the Dashboard below.


Summary of Federal COVID-19 Recovery Funding


Federal Recovery Funding by Jurisdiction and Topic

Chicago
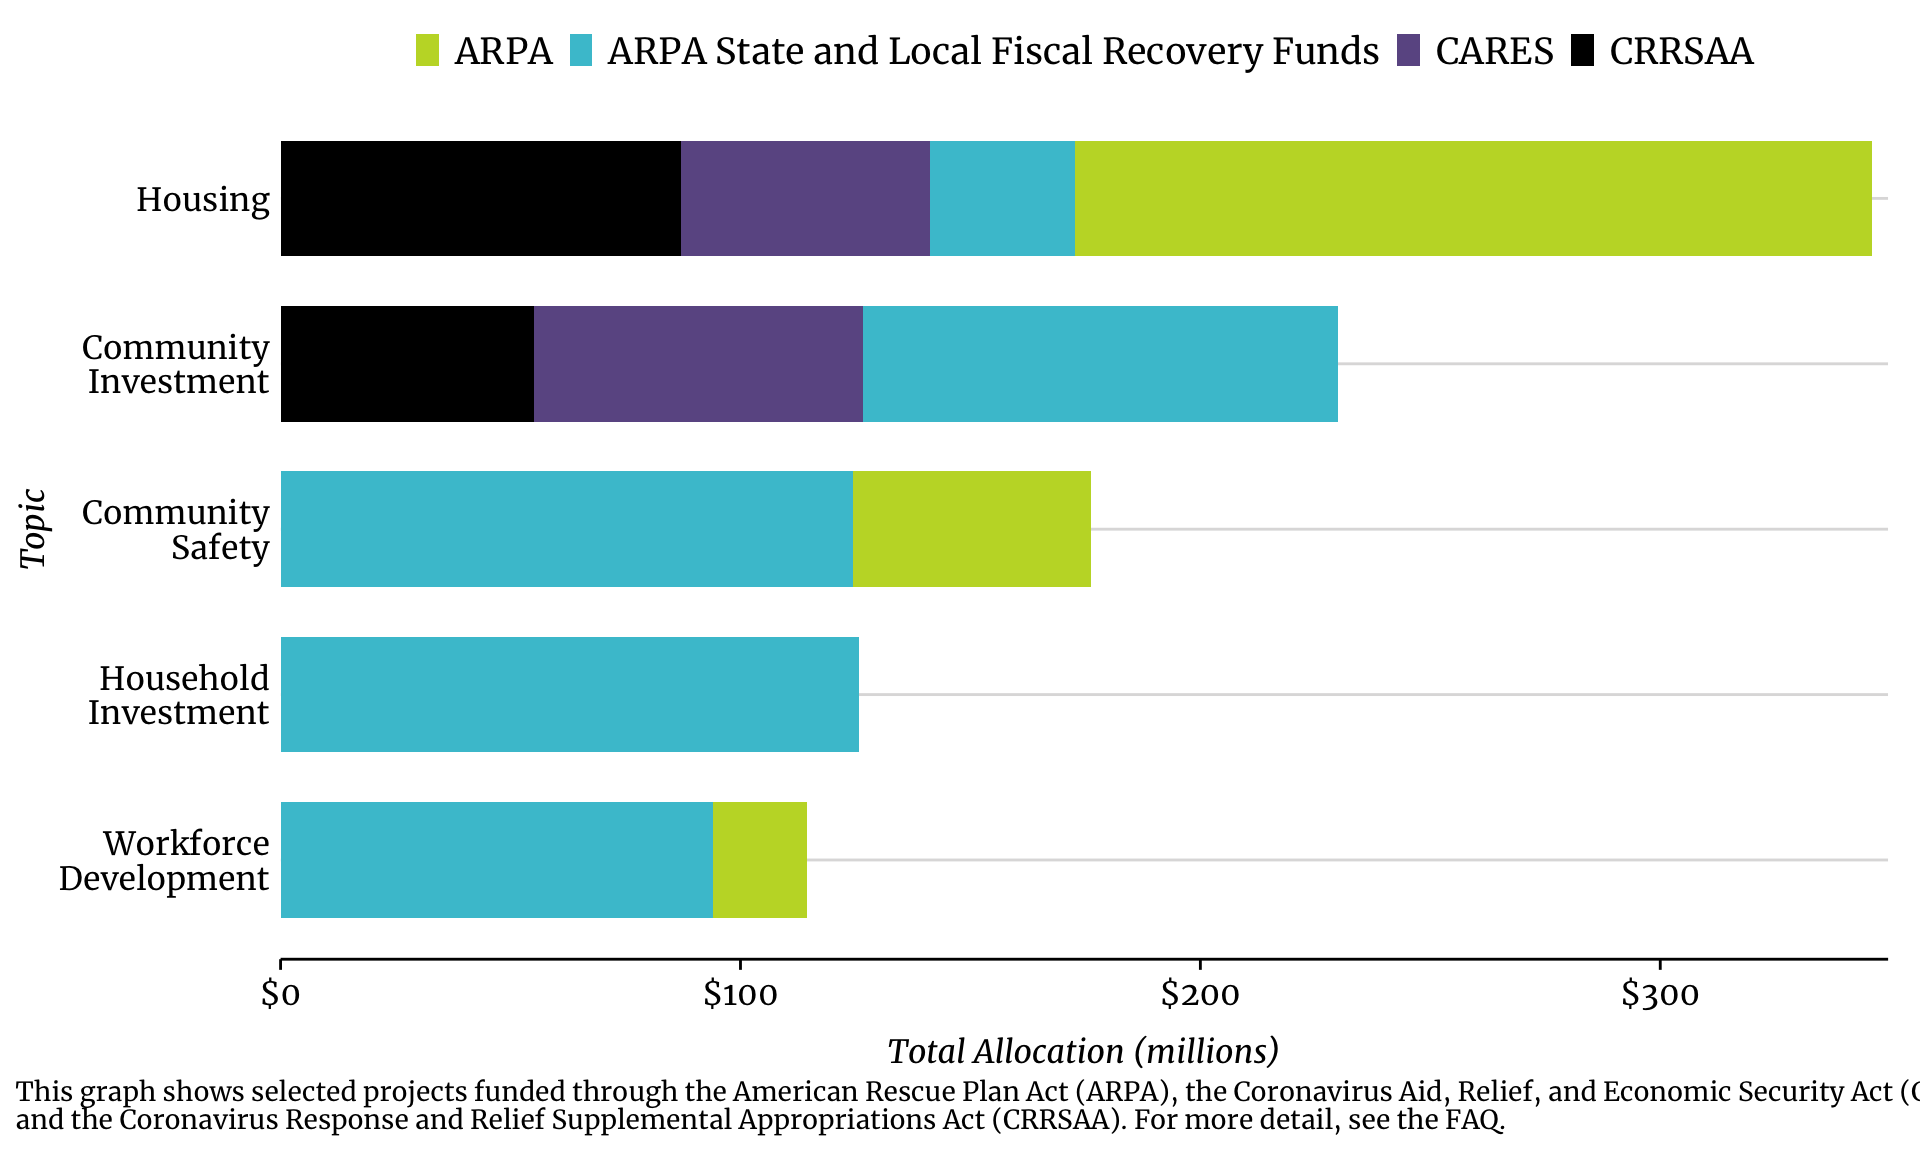
Bar chart of federal recovery allocations by legislation and policy topic for Chicago showing largest allocation to community investment programs.

Note: The ARPA State and Local Fiscal Recovery Funds funding source captures the ARPA Fiscal Recovery Funds for Chicago, shown by their planned spending topics and subtopics according to the Chicago Recovery Plan. The state/local discretionary funding topic reflects CARES Coronavirus Relief Fund flexible funding for which more detailed spending is not known.

Cook County
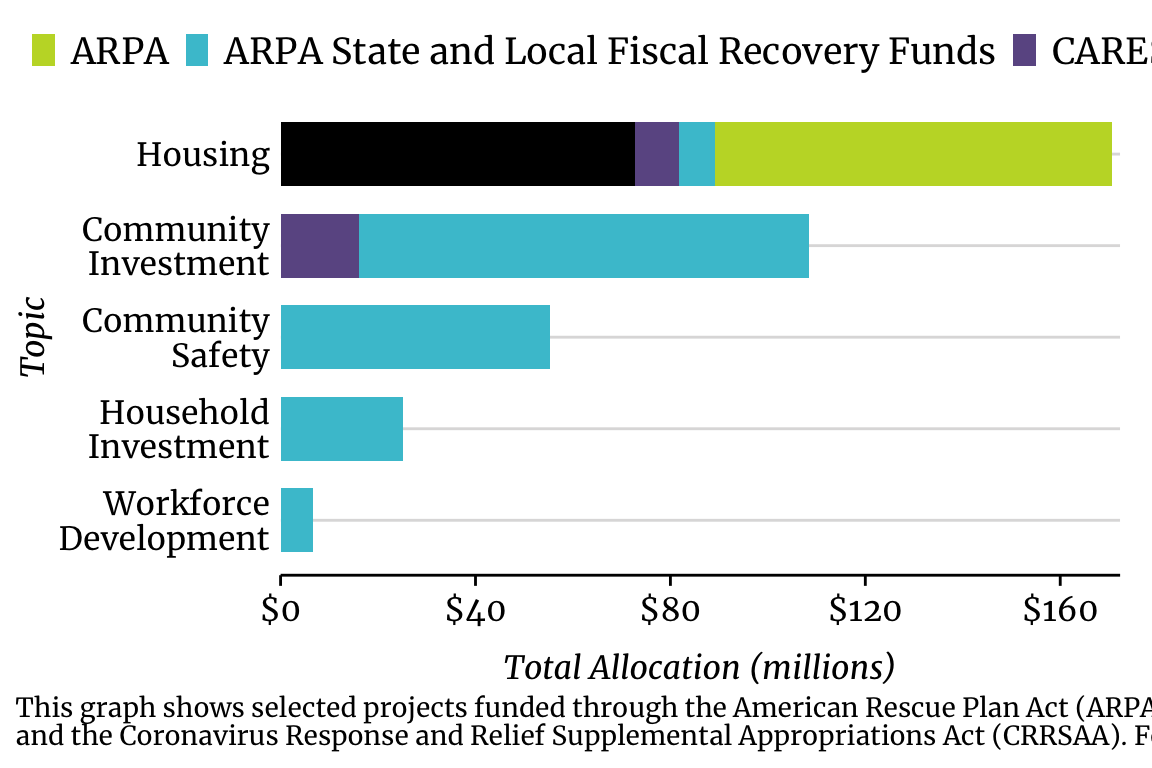
Bar chart of federal recovery allocations by legislation and policy topic for Cook County showing largest allocation to state and local discretionary funds, followed by housing programs.

Note: The ARPA State and Local Fiscal Recovery Funds funding source captures the ARPA Fiscal Recovery Funds for Cook County, shown by their planned spending topics and subtopics according to the Cook County ARPA Spending Plan. The state/local discretionary funding topic reflects CARES Coronavirus Relief Fund flexible funding for which more detailed spending is not known.

Illinois
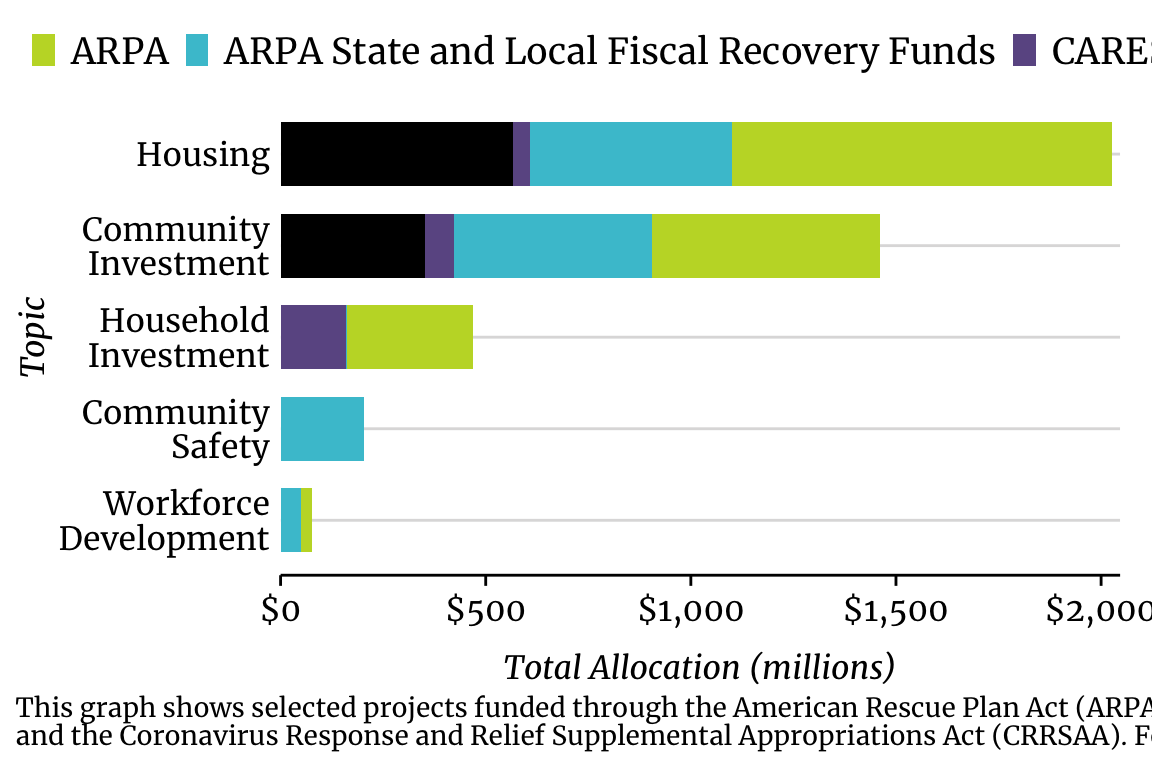
Bar chart of federal recovery allocations by legislation and policy topic for Illinois showing largest allocation to state and local discretionary funds, followed by housing programs.

Note: The ARPA State and Local Fiscal Recovery Funds funding source captures the ARPA Fiscal Recovery Funds for Cook County, shown by their planned spending topics and subtopics according to the Illinois ARPA Spending Plan. The state/local discretionary funding topic reflects CARES Coronavirus Relief Fund flexible funding for which more detailed spending is not known.

Explore ARPA State and Local Fiscal Recovery Funds Spending

Current Spending Compared to Original Allocations

Chicago
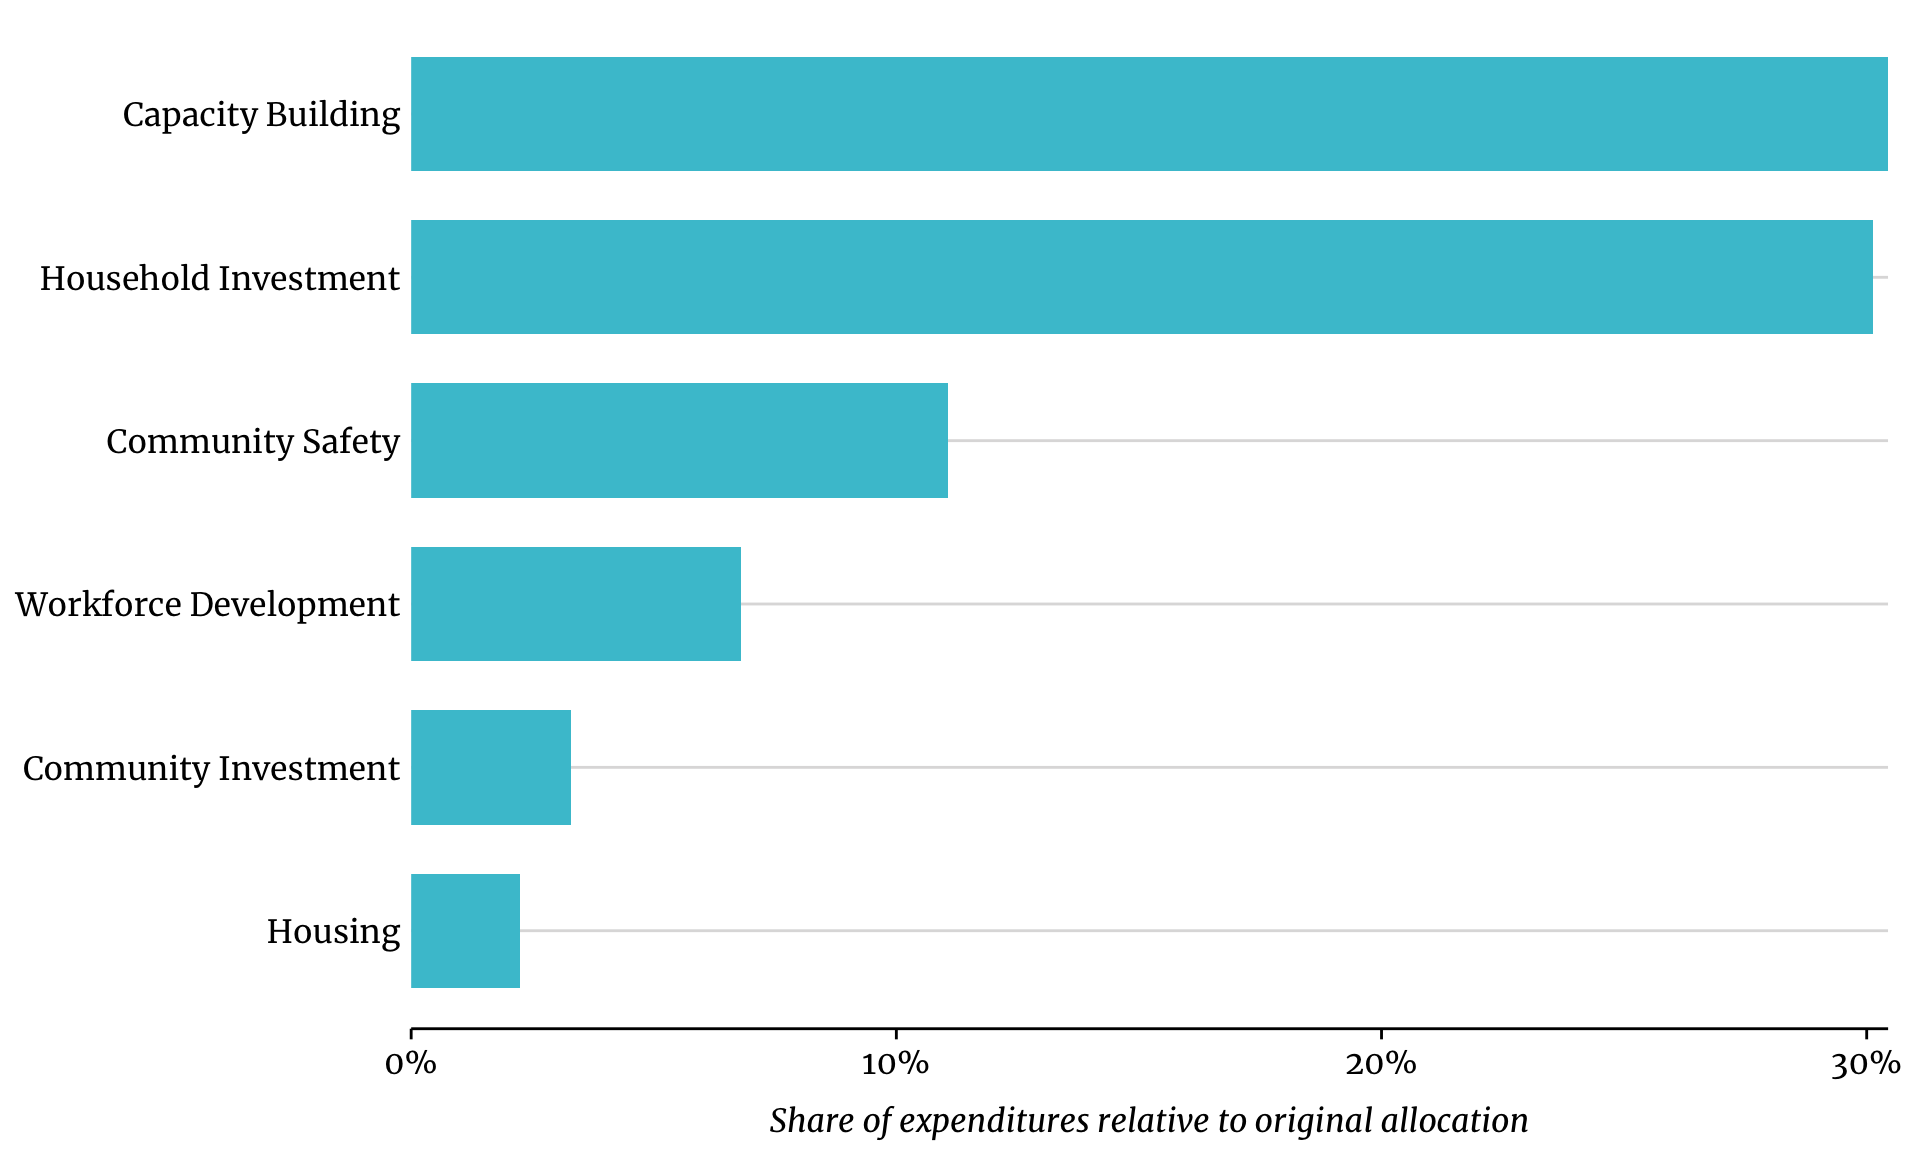
This graph compares the percent of ARPA SLFRF dollars by policy topic between the original recovery plan and spending to date

This graph compares the percent of ARPA SLFRF dollars by policy topic between the original recovery plan and spending to date

Cook County
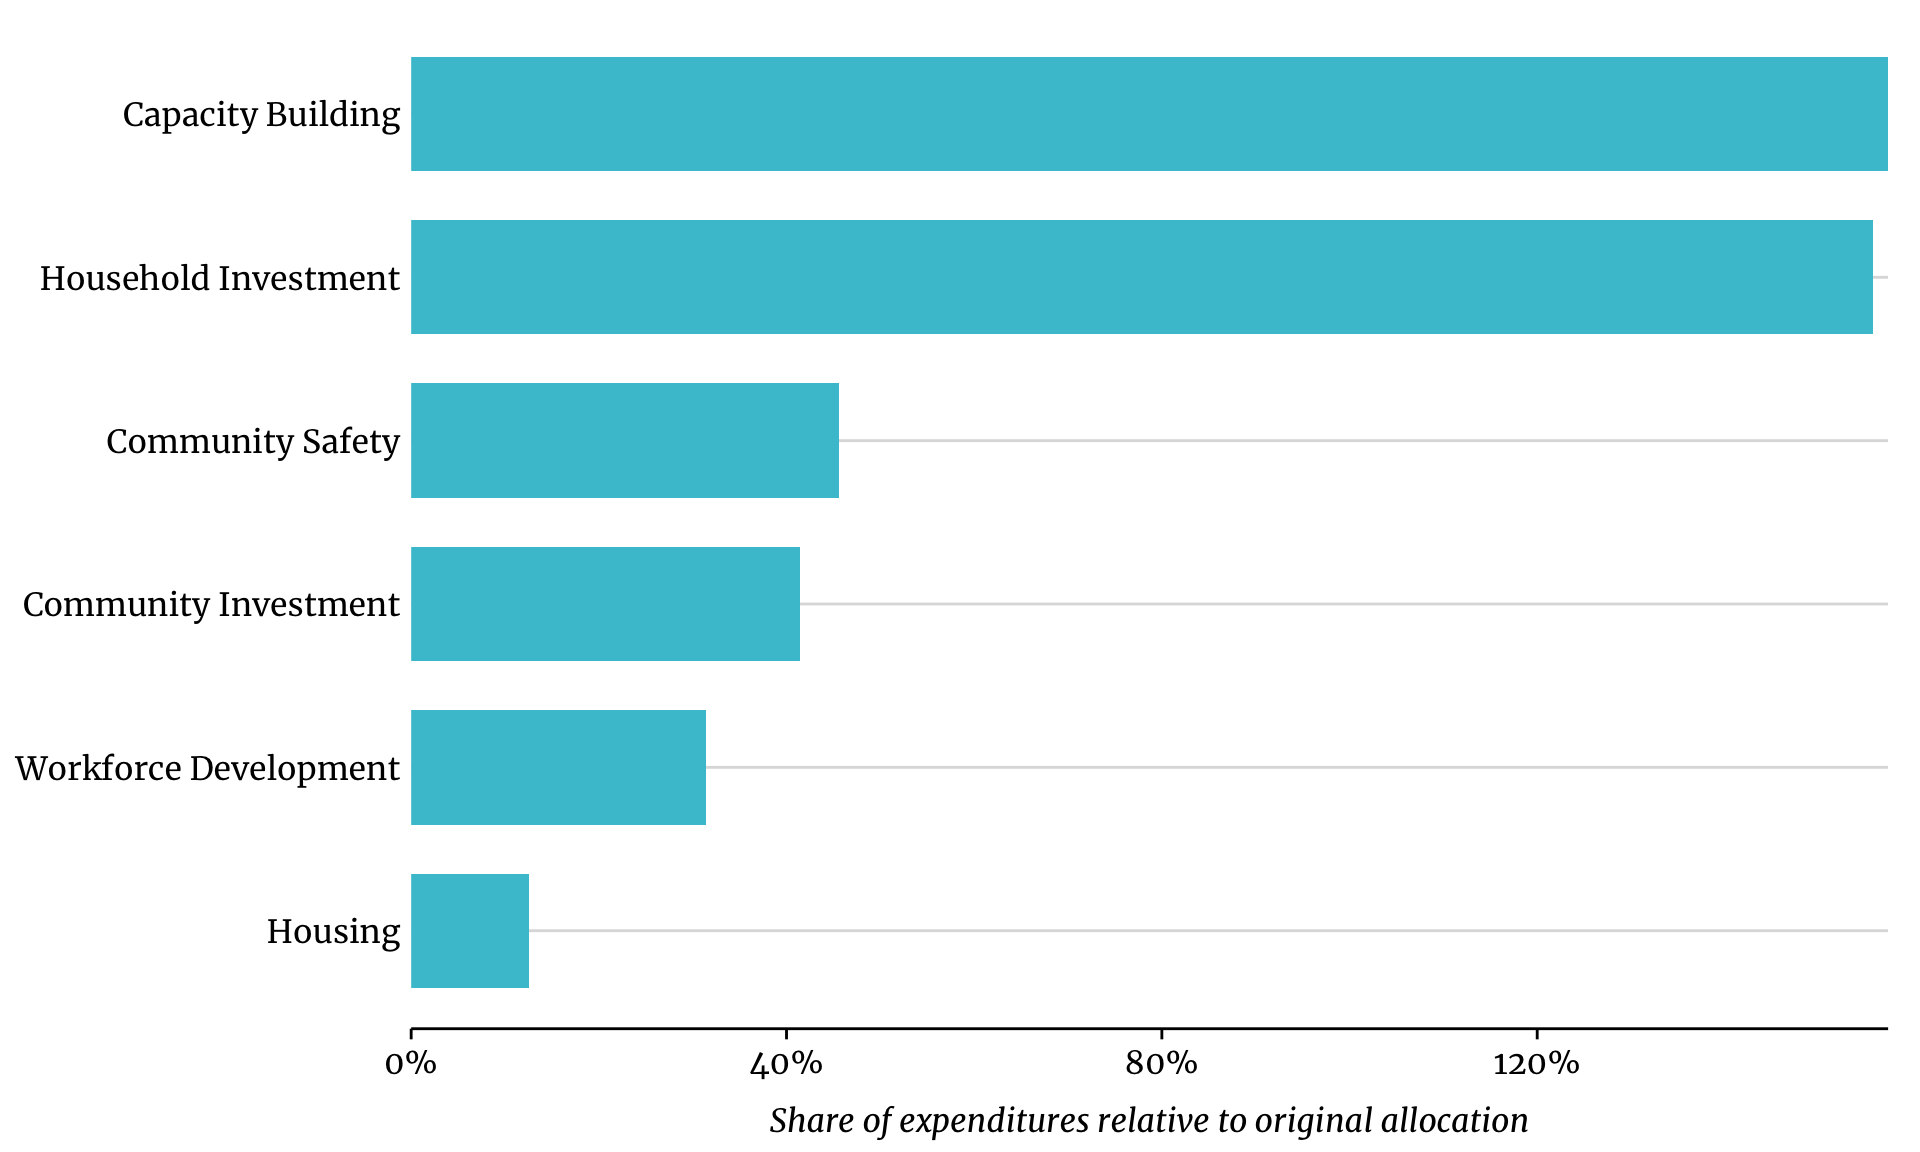
This graph compares the percent of ARPA SLFRF dollars by policy topic between the original recovery plan and spending to date

This graph compares the percent of ARPA SLFRF dollars by policy topic between the original recovery plan and spending to date

Illinois
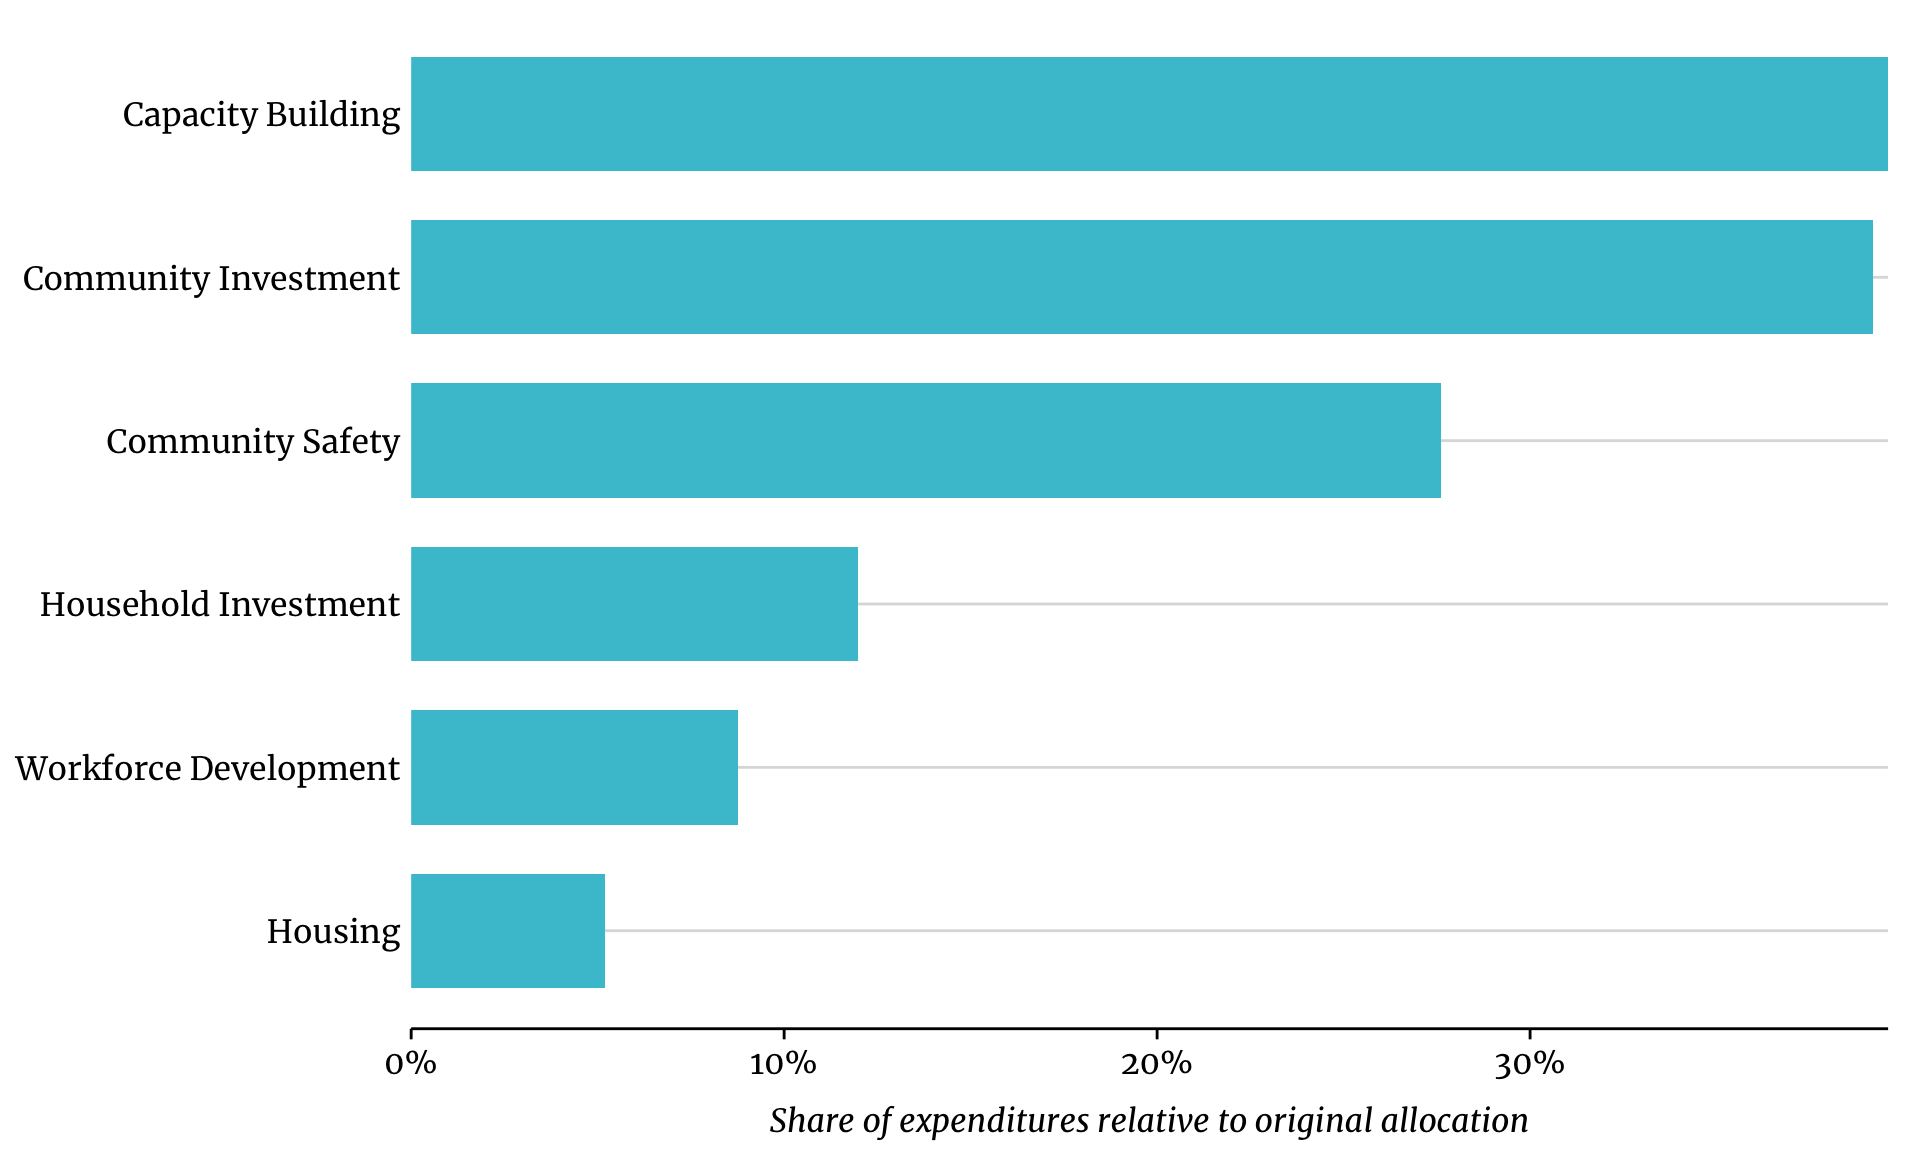
This graph compares the percent of ARPA SLFRF dollars by policy topic between the original recovery plan and spending to date

This graph compares the percent of ARPA SLFRF dollars by policy topic between the original recovery plan and spending to date

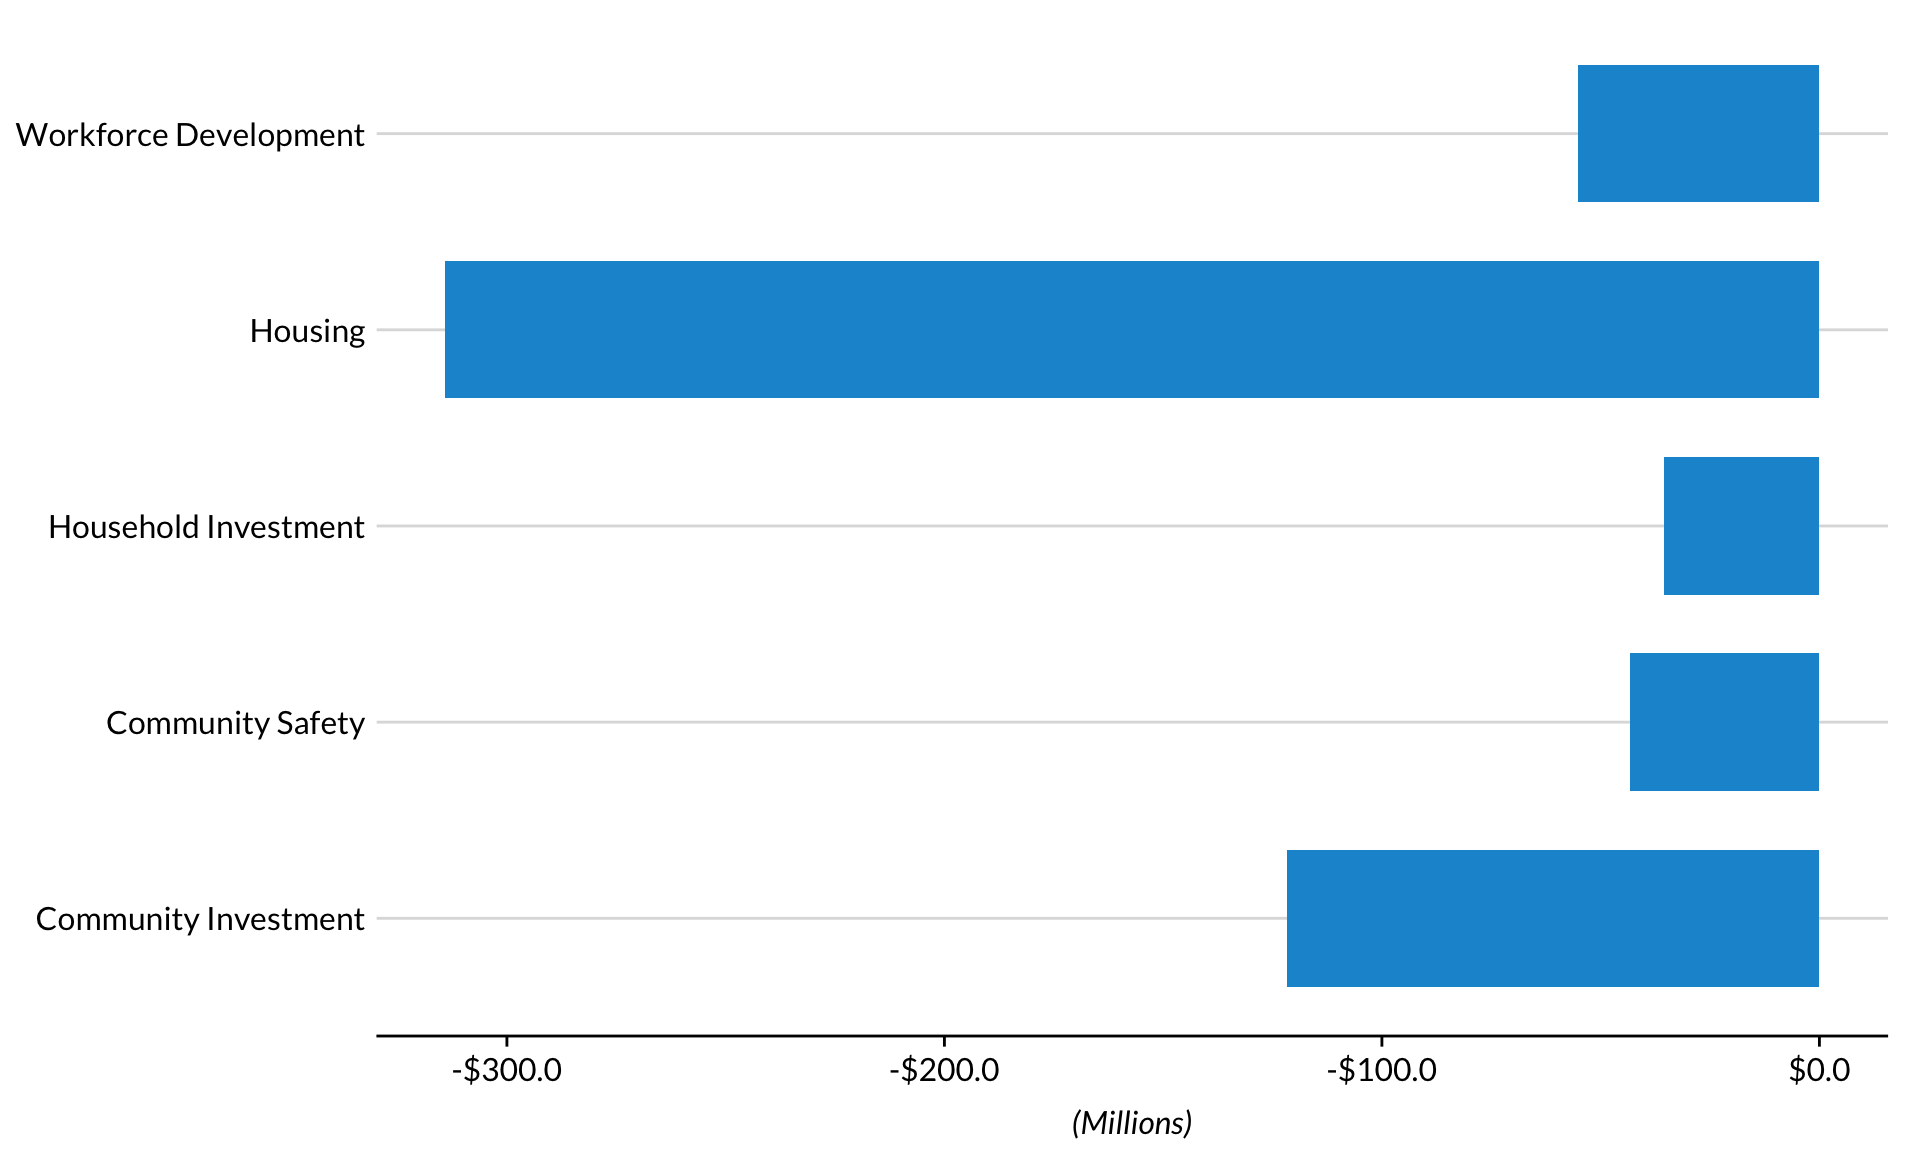
Gap Between Allocations and Adopted Budget

Option A:

Chicago
Cook County

Illinois

Option B:

Chicago

Cook County

Illinois

Adopted Funds Spent by Topic

Chicago

Cook County

Illinois

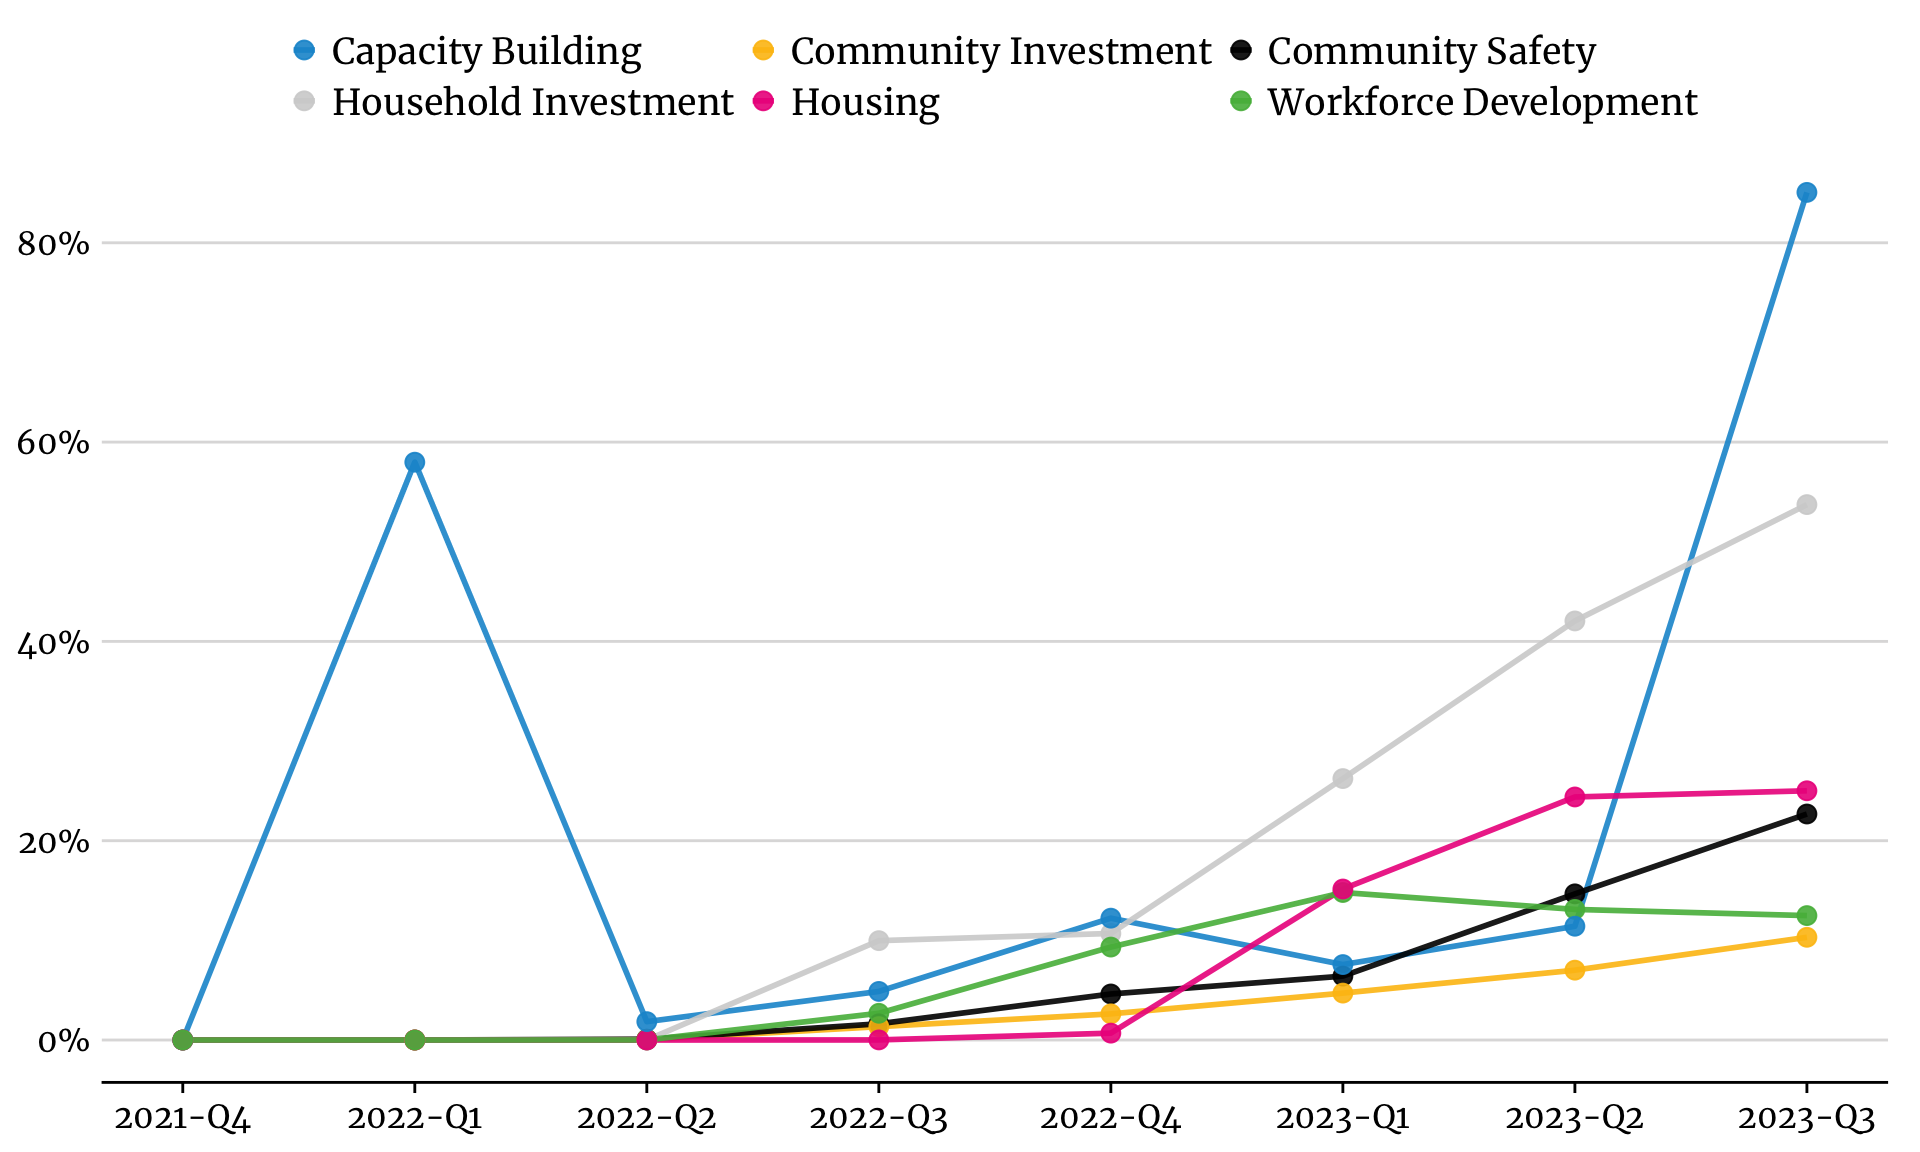
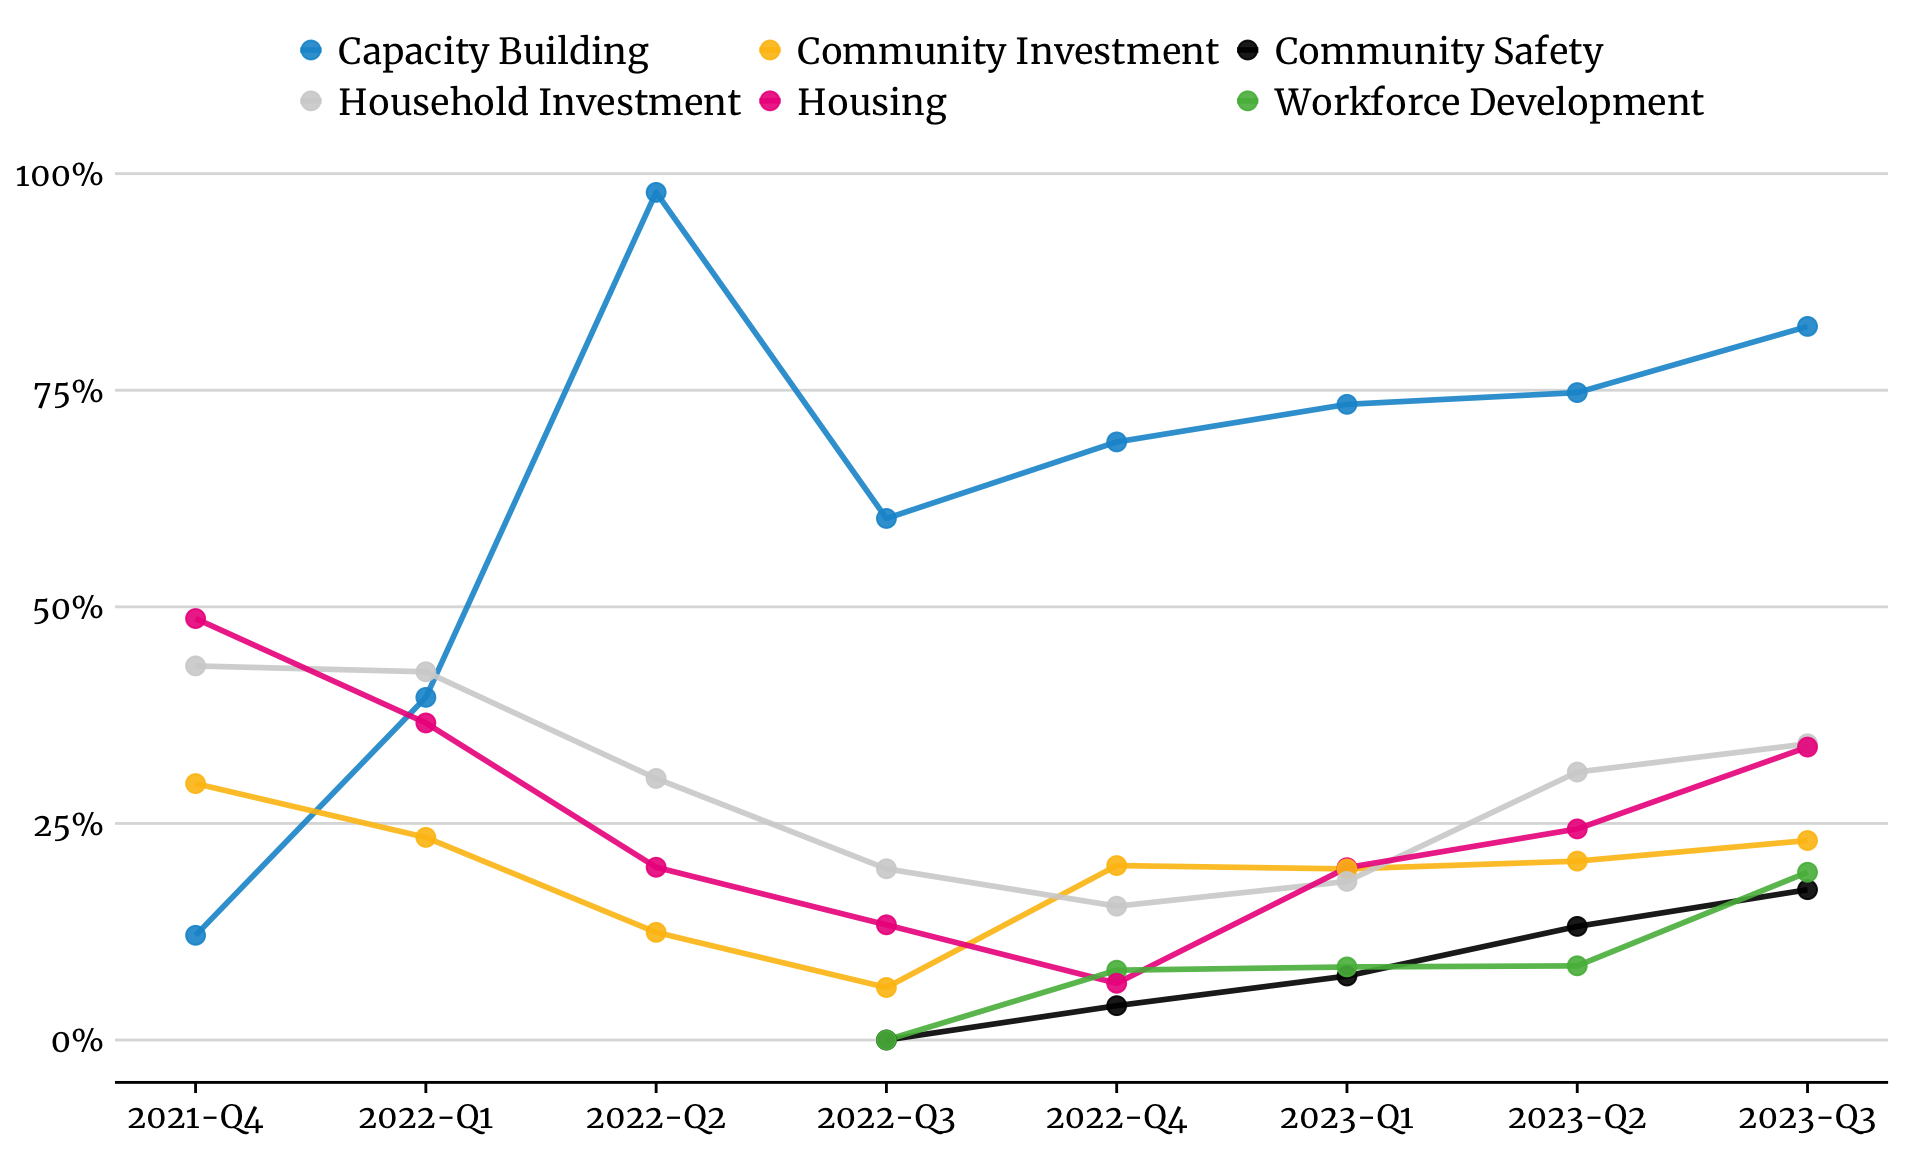
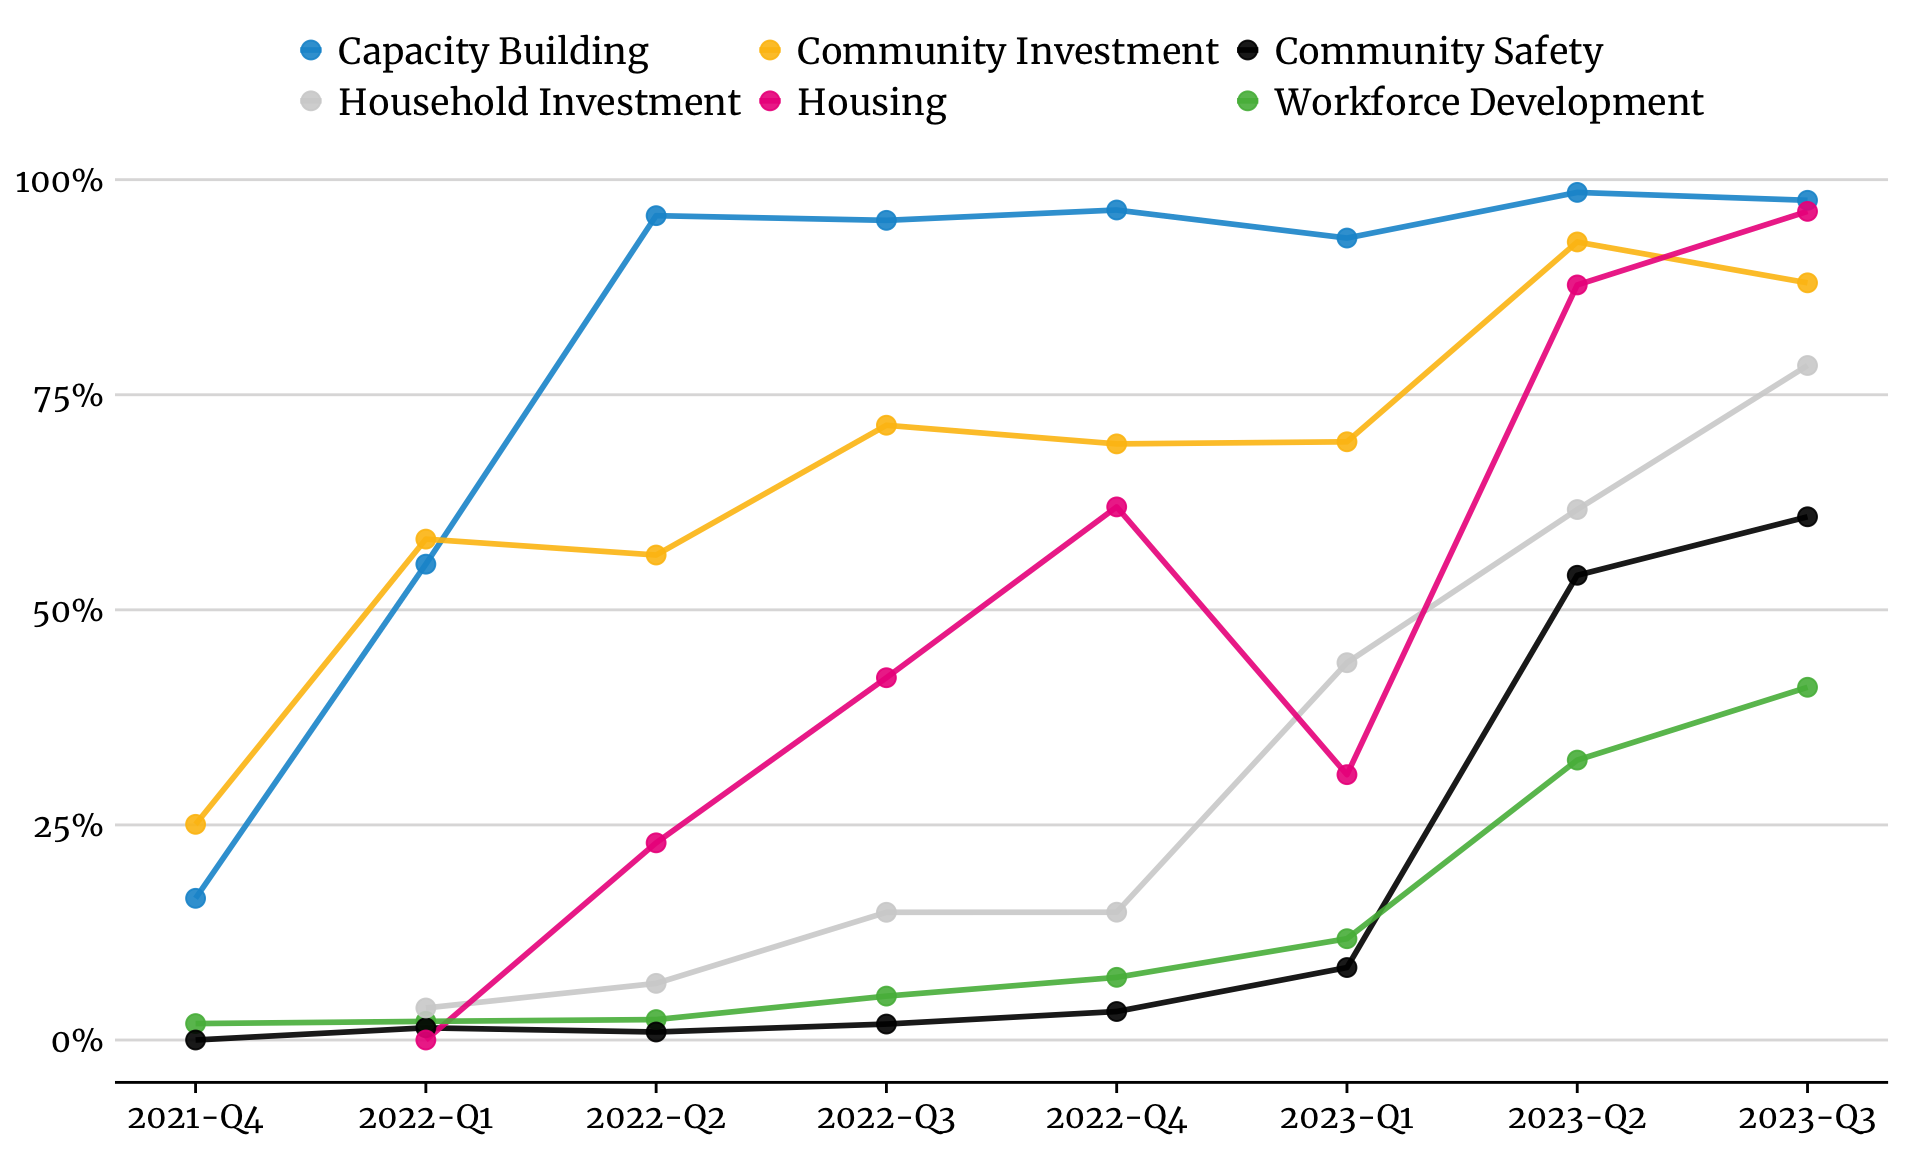
Spending by Quarter

Chicago
Cook County
Illinois
Explore Funding by Policy Area

Community Investment

Funding Summary

By Funding Source

Bar chart showing community investment allocations by jurisdiction and funding source.

By Subtopic

Bar chart showing community investment allocations by jurisdiction and the following subtopics: small business, community development, infrastructure, transportation.

Explore the specific programs:

Chicago

Programs Chart
All

For specific program details, see Programs Description tab

Treemap showing Community Investment projects in Chicago funded by ARPA, ARPA State and Local Fiscal Recovery Funds, CARES, and CRRSAA. Each program is a rectangle with the size of the rectangle proportional to the allocation amount. The one or more programs with the highest allocation is Community Development Block Grant with $66,860,727 allocated.

ARPA

For specific program details, see Programs Description tab

## [1] "There are no programs with known allocations in this policy area."
ARPA State and Local Fiscal Recovery Funds

For specific program details, see Programs Description tab

Treemap showing Community Investment projects in Chicago funded by ARPA State and Local Fiscal Recovery Funds. Each program is a rectangle with the size of the rectangle proportional to the allocation amount. The one or more programs with the highest allocation is Commercial corridors and responsive neighborhood activation investments with $48,600,000 allocated.

CARES

For specific program details, see Programs Description tab

Treemap showing Community Investment projects in Chicago funded by CARES. Each program is a rectangle with the size of the rectangle proportional to the allocation amount. The one or more programs with the highest allocation is Community Development Block Grant with $66,860,727 allocated.

CRRSAA

For specific program details, see Programs Description tab

Treemap showing Community Investment projects in Chicago funded by CRRSAA. Each program is a rectangle with the size of the rectangle proportional to the allocation amount. The one or more programs with the highest allocation is Surface Transportation Block Grant Program (STBGP) with $55,025,699 allocated.

Chicago Recovery Plan

The City of Chicago has issued a general obligation bond to fund some of the initiatives in its Recovery Plan. Chicago is the only jurisdiction in this dashboard that is explicitly blending local and federal dollars in its Recovery Plan. While the rest of the dashboard only tracks federal funds, we show the bond funding here to provide the full picture of Chicago’s Recovery Plan. For specific program details, see Programs Description tab

There are no programs for the selected jurisdiction, funding source, and topic.

Programs Description

Download the data (.zip)

Cook County

Programs Chart
All

For specific program details, see Programs Description tab

Treemap showing Community Investment projects in Cook County funded by ARPA, ARPA State and Local Fiscal Recovery Funds, CARES, and CRRSAA. Each program is a rectangle with the size of the rectangle proportional to the allocation amount. The one or more programs with the highest allocation is Community Development Block Grant with $16,018,096 allocated.

ARPA

For specific program details, see Programs Description tab

## [1] "There are no programs with known allocations in this policy area."
ARPA State and Local Fiscal Recovery Funds

For specific program details, see Programs Description tab

Treemap showing Community Investment projects in Cook County funded by ARPA State and Local Fiscal Recovery Funds. Each program is a rectangle with the size of the rectangle proportional to the allocation amount. The one or more programs with the highest allocation is Electric vehicle charging stations and Invest in Cook expansion with $15,262,107 allocated.

*Indicates programs for which exact allocation is unknown. Allocation is estimated by dividing topic area allocations published by Cook County by number of programs in topic area.

CARES

For specific program details, see Programs Description tab

Treemap showing Community Investment projects in Cook County funded by CARES. Each program is a rectangle with the size of the rectangle proportional to the allocation amount. The one or more programs with the highest allocation is Community Development Block Grant with $16,018,096 allocated.

CRRSAA

For specific program details, see Programs Description tab

## [1] "There are no programs with known allocations in this policy area."
Programs Description

Download the data (.zip)

Illinois

Programs Chart
All

For specific program details, see Programs Description tab

Treemap showing Community Investment projects in Illinois funded by ARPA, ARPA State and Local Fiscal Recovery Funds, CARES, and CRRSAA. Each program is a rectangle with the size of the rectangle proportional to the allocation amount. The one or more programs with the highest allocation is Surface Transportation Block Grant Program (STBGP) with $352,911,487 allocated.

ARPA

For specific program details, see Programs Description tab

Treemap showing Community Investment projects in Illinois funded by ARPA. Each program is a rectangle with the size of the rectangle proportional to the allocation amount. The one or more programs with the highest allocation is State Small Business Credit Initiative with $281,892,497 allocated.

ARPA State and Local Fiscal Recovery Funds

For specific program details, see Programs Description tab

Treemap showing Community Investment projects in Illinois funded by ARPA State and Local Fiscal Recovery Funds. Each program is a rectangle with the size of the rectangle proportional to the allocation amount. The one or more programs with the highest allocation is Back to Business Grant Program with $300,000,000 allocated.

CARES

For specific program details, see Programs Description tab

Treemap showing Community Investment projects in Illinois funded by CARES. Each program is a rectangle with the size of the rectangle proportional to the allocation amount. The one or more programs with the highest allocation is Community Development Block Grant with $70,753,404 allocated.

CRRSAA

For specific program details, see Programs Description tab

Treemap showing Community Investment projects in Illinois funded by CRRSAA. Each program is a rectangle with the size of the rectangle proportional to the allocation amount. The one or more programs with the highest allocation is Surface Transportation Block Grant Program (STBGP) with $352,911,487 allocated.

Programs Description

Download the data (.zip)

Total

Download the data (.zip)=

Community Safety

Funding Summary

By Funding Source

Bar chart showing community safety allocations by jurisdiction and funding source.

By Subtopic

Bar chart showing community safety allocations by jurisdiction and the following subtopics: alternative emergency response, victim supports, returning/justice involved residents, violence prevention/reduction, and criminal justice reform.

Explore the specific programs:

Chicago

Programs Chart
All

For specific program details, see Programs Description tab

Treemap showing Community Safety projects in Chicago funded by ARPA, ARPA State and Local Fiscal Recovery Funds, CARES, and CRRSAA. Each program is a rectangle with the size of the rectangle proportional to the allocation amount. The one or more programs with the highest allocation is Head Start with $51,778,046 allocated.

ARPA

For specific program details, see Programs Description tab

Treemap showing Community Safety projects in Chicago funded by ARPA. Each program is a rectangle with the size of the rectangle proportional to the allocation amount. The one or more programs with the highest allocation is Head Start with $51,778,046 allocated.

ARPA State and Local Fiscal Recovery Funds

For specific program details, see Programs Description tab

Treemap showing Community Safety projects in Chicago funded by ARPA State and Local Fiscal Recovery Funds. Each program is a rectangle with the size of the rectangle proportional to the allocation amount. The one or more programs with the highest allocation is Resources for community safety initiatives and violence reduction initiatives with $45,000,000 allocated.

CARES

For specific program details, see Programs Description tab

## [1] "There are no programs with known allocations in this policy area."
CRRSAA

For specific program details, see Programs Description tab

## [1] "There are no programs with known allocations in this policy area."
Chicago Recovery Plan

The City of Chicago has issued a general obligation bond to fund some of the initiatives in its Recovery Plan. Chicago is the only jurisdiction in this dashboard that is explicitly blending local and federal dollars in its Recovery Plan. While the rest of the dashboard only tracks federal funds, we show the bond funding here to provide the full picture of Chicago’s Recovery Plan. For specific program details, see Programs Description tab

Treemap showing Community Safety projects in Chicago funded by Chicago General Obligation Bond. Each program is a rectangle with the size of the rectangle proportional to the allocation amount. The one or more programs with the highest allocation is Gender-based violence reduction with $5,000,000 allocated.

Programs Description

Download the data (.zip)

Cook County

Programs Chart
All

For specific program details, see Programs Description tab

Treemap showing Community Safety projects in Cook County funded by ARPA, ARPA State and Local Fiscal Recovery Funds, CARES, and CRRSAA. Each program is a rectangle with the size of the rectangle proportional to the allocation amount. The one or more programs with the highest allocation is Behavioral health expansion and Gun Crime Strategy Unit and Healing Hurt People Chicago and State's Attorney's Office Crime Investigations and Strengthening Chicago's youth juvenile justice collaborative expansion and Supporting education and employment development and Violence prevention and reduction grant portfolio with $5,127,024 allocated.

ARPA

For specific program details, see Programs Description tab

## [1] "There are no programs with known allocations in this policy area."
ARPA State and Local Fiscal Recovery Funds

For specific program details, see Programs Description tab

Treemap showing Community Safety projects in Cook County funded by ARPA State and Local Fiscal Recovery Funds. Each program is a rectangle with the size of the rectangle proportional to the allocation amount. The one or more programs with the highest allocation is Behavioral health expansion and Gun Crime Strategy Unit and Healing Hurt People Chicago and State's Attorney's Office Crime Investigations and Strengthening Chicago's youth juvenile justice collaborative expansion and Supporting education and employment development and Violence prevention and reduction grant portfolio with $5,127,024 allocated.

*Indicates programs for which exact allocation is unknown. Allocation is estimated by dividing topic area allocations published by Cook County by number of programs in topic area.

CARES

For specific program details, see Programs Description tab

## [1] "There are no programs with known allocations in this policy area."
CRRSAA

For specific program details, see Programs Description tab

## [1] "There are no programs with known allocations in this policy area."
Programs Description

Download the data (.zip)

Illinois

Programs Chart
All

For specific program details, see Programs Description tab

Treemap showing Community Safety projects in Illinois funded by ARPA, ARPA State and Local Fiscal Recovery Funds, CARES, and CRRSAA. Each program is a rectangle with the size of the rectangle proportional to the allocation amount. The one or more programs with the highest allocation is Grant to the Black and Gold Initiative with $75,000,000 allocated.

ARPA

For specific program details, see Programs Description tab

## [1] "There are no programs with known allocations in this policy area."
ARPA State and Local Fiscal Recovery Funds

For specific program details, see Programs Description tab

Treemap showing Community Safety projects in Illinois funded by ARPA State and Local Fiscal Recovery Funds. Each program is a rectangle with the size of the rectangle proportional to the allocation amount. The one or more programs with the highest allocation is Grant to the Black and Gold Initiative with $75,000,000 allocated.

CARES

For specific program details, see Programs Description tab

## [1] "There are no programs with known allocations in this policy area."
CRRSAA

For specific program details, see Programs Description tab

## [1] "There are no programs with known allocations in this policy area."
Programs Description

Download the data (.zip)

Total

Download the data (.zip)

Household Investment

Funding Summary

By Funding Source

Bar chart showing household investment allocations by jurisdiction and funding source.

By Subtopic

Bar chart showing household investment allocations by jurisdiction and the following subtopics: household supportive services, targeted economic assistance, utility assistance, direct cash assistance.

Explore the specific programs:

Chicago

Programs Chart
All

For specific program details, see Programs Description tab

Treemap showing Household Investment projects in Chicago funded by ARPA, ARPA State and Local Fiscal Recovery Funds, CARES, and CRRSAA. Each program is a rectangle with the size of the rectangle proportional to the allocation amount. The one or more programs with the highest allocation is Targeted financial and legal assistance for underserved residents with $71,000,000 allocated.

ARPA

For specific program details, see Programs Description tab

## [1] "There are no programs with known allocations in this policy area."
ARPA State and Local Fiscal Recovery Funds

For specific program details, see Programs Description tab

Treemap showing Household Investment projects in Chicago funded by ARPA State and Local Fiscal Recovery Funds. Each program is a rectangle with the size of the rectangle proportional to the allocation amount. The one or more programs with the highest allocation is Targeted financial and legal assistance for underserved residents with $71,000,000 allocated.

CARES

For specific program details, see Programs Description tab

## [1] "There are no programs with known allocations in this policy area."
CRRSAA

For specific program details, see Programs Description tab

## [1] "There are no programs with known allocations in this policy area."
Chicago Recovery Plan

The City of Chicago has issued a general obligation bond to fund some of the initiatives in its Recovery Plan. Chicago is the only jurisdiction in this dashboard that is explicitly blending local and federal dollars in its Recovery Plan. While the rest of the dashboard only tracks federal funds, we show the bond funding here to provide the full picture of Chicago’s Recovery Plan. For specific program details, see Programs Description tab

Treemap showing Household Investment projects in Chicago funded by Chicago General Obligation Bond. Each program is a rectangle with the size of the rectangle proportional to the allocation amount. The one or more programs with the highest allocation is Increase access to broadband internet connection with $18,000,000 allocated.

Programs Description

Download the data (.zip)

Cook County

Programs Chart
All

For specific program details, see Programs Description tab

Treemap showing Household Investment projects in Cook County funded by ARPA, ARPA State and Local Fiscal Recovery Funds, CARES, and CRRSAA. Each program is a rectangle with the size of the rectangle proportional to the allocation amount. The one or more programs with the highest allocation is Abolish Medical Debt and Community Information Exchange and Legal Aid and Eviction Prevention and Cook County Residential Water Conservation and Energy Efficiency Program and Cook County Water Affordability Program and Guaranteed Income Program and Veteran grant program with $3,587,500 allocated.

ARPA

For specific program details, see Programs Description tab

## [1] "There are no programs with known allocations in this policy area."
ARPA State and Local Fiscal Recovery Funds

For specific program details, see Programs Description tab

Treemap showing Household Investment projects in Cook County funded by ARPA State and Local Fiscal Recovery Funds. Each program is a rectangle with the size of the rectangle proportional to the allocation amount. The one or more programs with the highest allocation is Abolish Medical Debt and Community Information Exchange and Legal Aid and Eviction Prevention and Cook County Residential Water Conservation and Energy Efficiency Program and Cook County Water Affordability Program and Guaranteed Income Program and Veteran grant program with $3,587,500 allocated.

*Indicates programs for which exact allocation is unknown. Allocation is estimated by dividing topic area allocations published by Cook County by number of programs in topic area.

CARES

For specific program details, see Programs Description tab

## [1] "There are no programs with known allocations in this policy area."
CRRSAA

For specific program details, see Programs Description tab

## [1] "There are no programs with known allocations in this policy area."
Programs Description

Download the data (.zip)

Illinois

Programs Chart
All

For specific program details, see Programs Description tab

Treemap showing Household Investment projects in Illinois funded by ARPA, ARPA State and Local Fiscal Recovery Funds, CARES, and CRRSAA. Each program is a rectangle with the size of the rectangle proportional to the allocation amount. The one or more programs with the highest allocation is Low Income Home Energy Assistance Program with $252,788,881 allocated.

ARPA

For specific program details, see Programs Description tab

Treemap showing Household Investment projects in Illinois funded by ARPA. Each program is a rectangle with the size of the rectangle proportional to the allocation amount. The one or more programs with the highest allocation is Low Income Home Energy Assistance Program with $252,788,881 allocated.

ARPA State and Local Fiscal Recovery Funds

For specific program details, see Programs Description tab

Treemap showing Household Investment projects in Illinois funded by ARPA State and Local Fiscal Recovery Funds. Each program is a rectangle with the size of the rectangle proportional to the allocation amount. The one or more programs with the highest allocation is Unemployment Insurance Extension Implementation Grants with $275,000 allocated.

CARES

For specific program details, see Programs Description tab

Treemap showing Household Investment projects in Illinois funded by CARES. Each program is a rectangle with the size of the rectangle proportional to the allocation amount. The one or more programs with the highest allocation is Child Care and Development Block Grant with $118,420,119 allocated.

CRRSAA

For specific program details, see Programs Description tab

## [1] "There are no programs with known allocations in this policy area."
Programs Description

Download the data (.zip)

Total

Download the data (.zip)

Housing

Funding Summary

By Funding Source

Bar chart showing housing allocations by jurisdiction and funding source.

By Subtopic

Bar chart showing housing allocations by jurisdiction and the following subtopics: affordable housing, homeowner's assistance, renter's assistance, homelessness support/prevention.

Explore the specific programs:

Chicago

Programs Chart
All

For specific program details, see Programs Description tab

Treemap showing Housing projects in Chicago funded by ARPA, ARPA State and Local Fiscal Recovery Funds, CARES, and CRRSAA. Each program is a rectangle with the size of the rectangle proportional to the allocation amount. The one or more programs with the highest allocation is Emergency Rental Housing Assistance (ERA2) with $102,200,000 allocated.

ARPA

For specific program details, see Programs Description tab

Treemap showing Housing projects in Chicago funded by ARPA. Each program is a rectangle with the size of the rectangle proportional to the allocation amount. The one or more programs with the highest allocation is Emergency Rental Housing Assistance (ERA2) with $102,200,000 allocated.

ARPA State and Local Fiscal Recovery Funds

For specific program details, see Programs Description tab

Treemap showing Housing projects in Chicago funded by ARPA State and Local Fiscal Recovery Funds. Each program is a rectangle with the size of the rectangle proportional to the allocation amount. The one or more programs with the highest allocation is Rapid rehousing program with $19,500,000 allocated.

CARES

For specific program details, see Programs Description tab

Treemap showing Housing projects in Chicago funded by CARES. Each program is a rectangle with the size of the rectangle proportional to the allocation amount. The one or more programs with the highest allocation is Homeless Assistance Grants (Emergency Solution Grants) with $54,201,546 allocated.

CRRSAA

For specific program details, see Programs Description tab

Treemap showing Housing projects in Chicago funded by CRRSAA. Each program is a rectangle with the size of the rectangle proportional to the allocation amount. The one or more programs with the highest allocation is Emergency Rental Assistance (ERA1) with $87,013,725 allocated.

Chicago Recovery Plan

The City of Chicago has issued a general obligation bond to fund some of the initiatives in its Recovery Plan. Chicago is the only jurisdiction in this dashboard that is explicitly blending local and federal dollars in its Recovery Plan. While the rest of the dashboard only tracks federal funds, we show the bond funding here to provide the full picture of Chicago’s Recovery Plan. For specific program details, see Programs Description tab

Treemap showing Housing projects in Chicago funded by Chicago General Obligation Bond. Each program is a rectangle with the size of the rectangle proportional to the allocation amount. The one or more programs with the highest allocation is Development of mixed-use housing with $75,100,000 allocated.

Programs Description

Download the data (.zip)

Cook County

Programs Chart
All

For specific program details, see Programs Description tab

Treemap showing Housing projects in Cook County funded by ARPA, ARPA State and Local Fiscal Recovery Funds, CARES, and CRRSAA. Each program is a rectangle with the size of the rectangle proportional to the allocation amount. The one or more programs with the highest allocation is Emergency Rental Assistance (ERA1) with $72,808,624 allocated.

ARPA

For specific program details, see Programs Description tab

Treemap showing Housing projects in Cook County funded by ARPA. Each program is a rectangle with the size of the rectangle proportional to the allocation amount. The one or more programs with the highest allocation is Emergency Rental Assistance (ERA2) with $57,610,057 allocated.

ARPA State and Local Fiscal Recovery Funds

For specific program details, see Programs Description tab

Treemap showing Housing projects in Cook County funded by ARPA State and Local Fiscal Recovery Funds. Each program is a rectangle with the size of the rectangle proportional to the allocation amount. The one or more programs with the highest allocation is Emergency Mortgage Assistance and Emergency Rental Housing Assistance and Fixed-Site Emergency Shelter for People Experiencing Homelessness and Hotel-based sheltering and Permanent supportive housing for people experiencing homelessness with $1,493,333 allocated.

*Indicates programs for which exact allocation is unknown. Allocation is estimated by dividing topic area allocations published by Cook County by number of programs in topic area.

CARES

For specific program details, see Programs Description tab

Treemap showing Housing projects in Cook County funded by CARES. Each program is a rectangle with the size of the rectangle proportional to the allocation amount. The one or more programs with the highest allocation is Homeless Assistance Grants (Emergency Solution Grants) with $8,862,121 allocated.

CRRSAA

For specific program details, see Programs Description tab

Treemap showing Housing projects in Cook County funded by CRRSAA. Each program is a rectangle with the size of the rectangle proportional to the allocation amount. The one or more programs with the highest allocation is Emergency Rental Assistance (ERA1) with $72,808,624 allocated.

Programs Description

Download the data (.zip)

Illinois

Programs Chart
All

For specific program details, see Programs Description tab

Treemap showing Housing projects in Illinois funded by ARPA, ARPA State and Local Fiscal Recovery Funds, CARES, and CRRSAA. Each program is a rectangle with the size of the rectangle proportional to the allocation amount. The one or more programs with the highest allocation is Emergency Rental Assistance (ERA1) with $566,275,815 allocated.

ARPA

For specific program details, see Programs Description tab

Treemap showing Housing projects in Illinois funded by ARPA. Each program is a rectangle with the size of the rectangle proportional to the allocation amount. The one or more programs with the highest allocation is Emergency Rental Assistance (ERA2) with $477,000,000 allocated.

ARPA State and Local Fiscal Recovery Funds

For specific program details, see Programs Description tab

Treemap showing Housing projects in Illinois funded by ARPA State and Local Fiscal Recovery Funds. Each program is a rectangle with the size of the rectangle proportional to the allocation amount. The one or more programs with the highest allocation is Homeowner Assistance Fund with $386,903,117 allocated.

CARES

For specific program details, see Programs Description tab

Treemap showing Housing projects in Illinois funded by CARES. Each program is a rectangle with the size of the rectangle proportional to the allocation amount. The one or more programs with the highest allocation is Homeless Assistance Grants (Emergency Solution Grants) with $42,872,975 allocated.

CRRSAA

For specific program details, see Programs Description tab

Treemap showing Housing projects in Illinois funded by CRRSAA. Each program is a rectangle with the size of the rectangle proportional to the allocation amount. The one or more programs with the highest allocation is Emergency Rental Assistance (ERA1) with $566,275,815 allocated.

Programs Description

Download the data (.zip)

Total

Download the data (.zip)

Workforce Development

Funding Summary

By Funding Source

Bar chart showing workforce development allocations by jurisdiction and funding source.

By Subtopic

Bar chart showing workforce development allocations by jurisdiction and the following subtopics: employment opportunities, workforce sustainability, job training, workforce supportive services.

Explore the specific programs:

Chicago

Programs Chart
All

For specific program details, see Programs Description tab

Treemap showing Workforce Development projects in Chicago funded by ARPA, ARPA State and Local Fiscal Recovery Funds, CARES, and CRRSAA. Each program is a rectangle with the size of the rectangle proportional to the allocation amount. The one or more programs with the highest allocation is Youth programs with $65,000,000 allocated.

ARPA

For specific program details, see Programs Description tab

Treemap showing Workforce Development projects in Chicago funded by ARPA. Each program is a rectangle with the size of the rectangle proportional to the allocation amount. The one or more programs with the highest allocation is Expanding the Public Health Workforce with $20,521,140 allocated.

ARPA State and Local Fiscal Recovery Funds

For specific program details, see Programs Description tab

Treemap showing Workforce Development projects in Chicago funded by ARPA State and Local Fiscal Recovery Funds. Each program is a rectangle with the size of the rectangle proportional to the allocation amount. The one or more programs with the highest allocation is Youth programs with $65,000,000 allocated.

CARES

For specific program details, see Programs Description tab

## [1] "There are no programs with known allocations in this policy area."
CRRSAA

For specific program details, see Programs Description tab

## [1] "There are no programs with known allocations in this policy area."
Chicago Recovery Plan

The City of Chicago has issued a general obligation bond to fund some of the initiatives in its Recovery Plan. Chicago is the only jurisdiction in this dashboard that is explicitly blending local and federal dollars in its Recovery Plan. While the rest of the dashboard only tracks federal funds, we show the bond funding here to provide the full picture of Chicago’s Recovery Plan. For specific program details, see Programs Description tab

There are no programs for the selected jurisdiction, funding source, and topic.

Programs Description

Download the data (.zip)

Cook County

Programs Chart
All

For specific program details, see Programs Description tab

Treemap showing Workforce Development projects in Cook County funded by ARPA, ARPA State and Local Fiscal Recovery Funds, CARES, and CRRSAA. Each program is a rectangle with the size of the rectangle proportional to the allocation amount. The one or more programs with the highest allocation is Community Conservation Corps and Investing in families and youth and Supporting apprenticeships in suburban Cook with $2,187,333 allocated.

ARPA

For specific program details, see Programs Description tab

## [1] "There are no programs with known allocations in this policy area."
ARPA State and Local Fiscal Recovery Funds

For specific program details, see Programs Description tab

Treemap showing Workforce Development projects in Cook County funded by ARPA State and Local Fiscal Recovery Funds. Each program is a rectangle with the size of the rectangle proportional to the allocation amount. The one or more programs with the highest allocation is Community Conservation Corps and Investing in families and youth and Supporting apprenticeships in suburban Cook with $2,187,333 allocated.

*Indicates programs for which exact allocation is unknown. Allocation is estimated by dividing topic area allocations published by Cook County by number of programs in topic area.

CARES

For specific program details, see Programs Description tab

## [1] "There are no programs with known allocations in this policy area."
CRRSAA

For specific program details, see Programs Description tab

## [1] "There are no programs with known allocations in this policy area."
Programs Description

Download the data (.zip)

Illinois

Programs Chart
All

For specific program details, see Programs Description tab

Treemap showing Workforce Development projects in Illinois funded by ARPA, ARPA State and Local Fiscal Recovery Funds, CARES, and CRRSAA. Each program is a rectangle with the size of the rectangle proportional to the allocation amount. The one or more programs with the highest allocation is Workforce recovery with $50,000,000 allocated.

ARPA

For specific program details, see Programs Description tab

Treemap showing Workforce Development projects in Illinois funded by ARPA. Each program is a rectangle with the size of the rectangle proportional to the allocation amount. The one or more programs with the highest allocation is Expanding the Public Health Workforce with $26,048,340 allocated.

ARPA State and Local Fiscal Recovery Funds

For specific program details, see Programs Description tab

Treemap showing Workforce Development projects in Illinois funded by ARPA State and Local Fiscal Recovery Funds. Each program is a rectangle with the size of the rectangle proportional to the allocation amount. The one or more programs with the highest allocation is Workforce recovery with $50,000,000 allocated.

CARES

For specific program details, see Programs Description tab

## [1] "There are no programs with known allocations in this policy area."
CRRSAA

For specific program details, see Programs Description tab

## [1] "There are no programs with known allocations in this policy area."
Programs Description

Download the data (.zip)

Total

Download the data (.zip)

State/Local Discretionary Funding

Funding Summary

Bar chart showing state and local discetionary funding allocations by jurisdiction and funding source where a more specific use is not known.

Explore the specific programs:

Download the data (.zip)


Explore Spending for Selected Programs:

This dashboard features a selection of federally-funded recovery programs for which detailed information on program spending is available. A program not being in this list does not indicate that the program funds haven’t been spent. We intend to add additional programs to this section over time as data becomes available.

Illinois Back to Business Grant Program

Funding by Zip Code

Hover your cursor over a zip code on the map below to see data for that zip code

Chicago Emergency Rental Assistance Program

Funding by Zip Code

Hover your cursor over a zip code on the map below to see data for that zip code

ARPA SLFRF

\(~\)

ARPA SLFRF Projects by Zip Code